


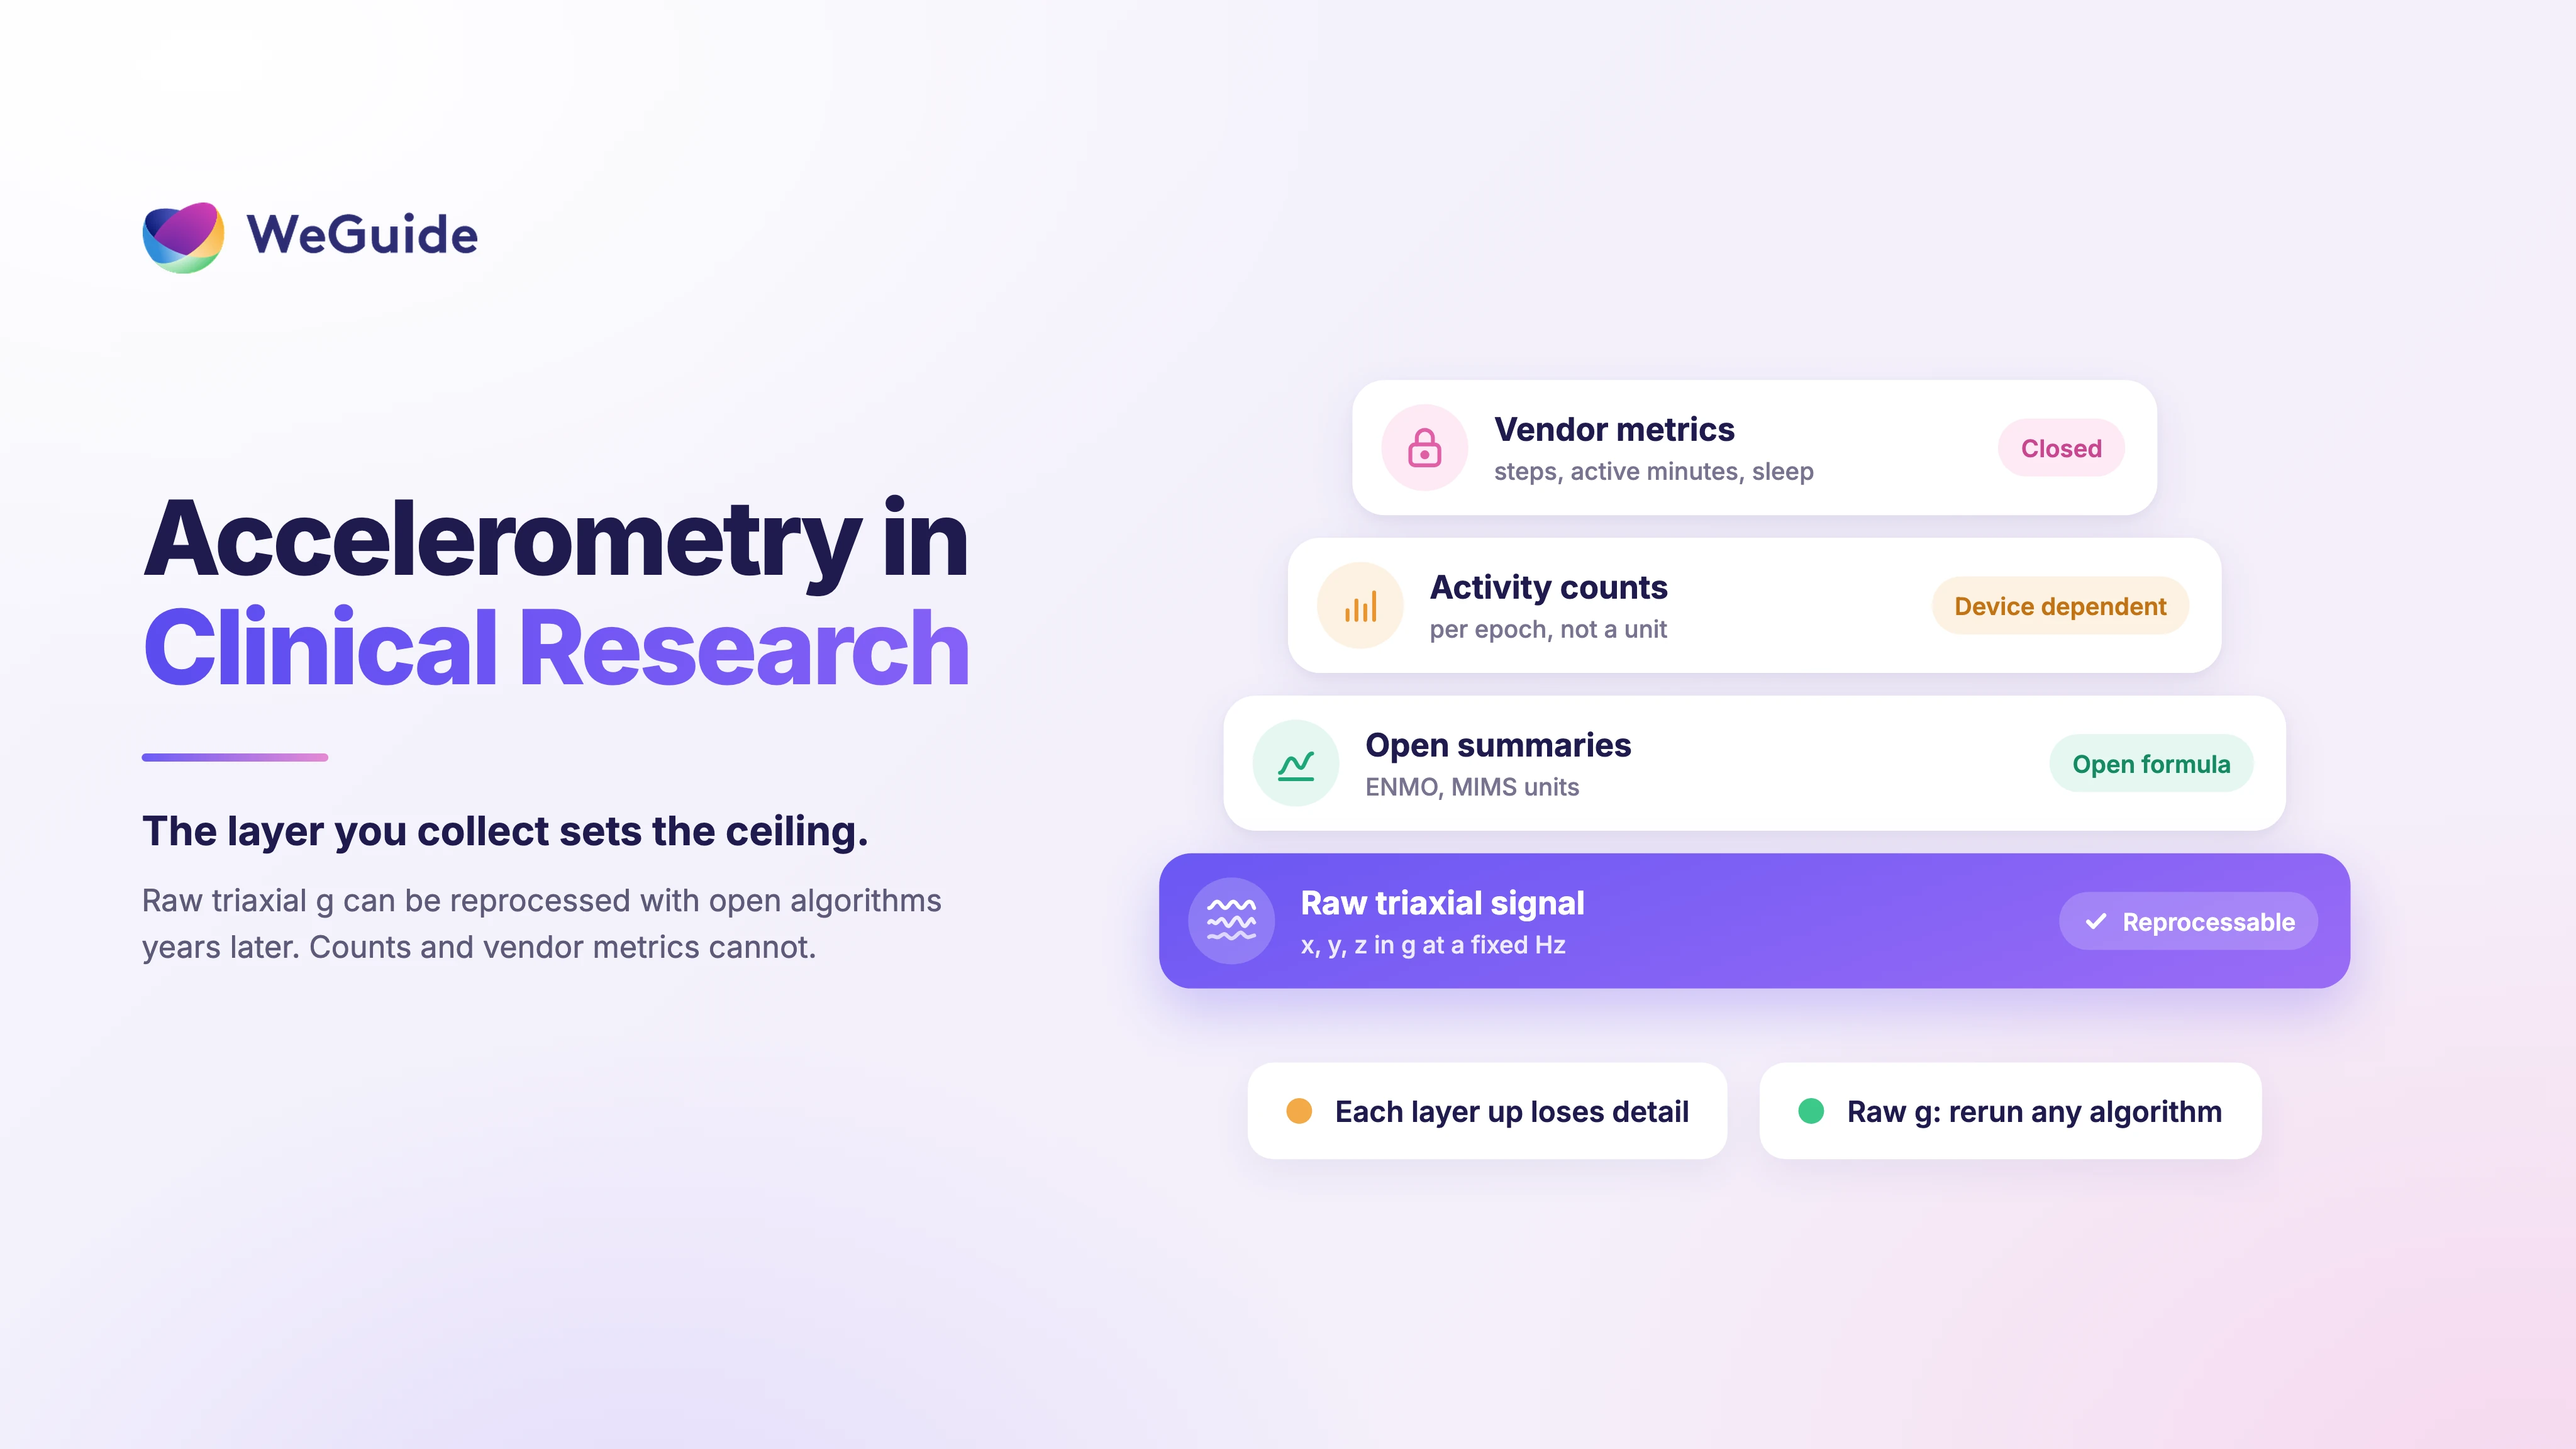


Accelerometry is the measurement of body movement as acceleration, in units of g, using a wearable accelerometer: a small triaxial sensor worn on the wrist, hip, ankle or trunk. Research grade analysis starts from the raw signal: three streams of numbers, one per axis, sampled many times a second.
Most consumer wearables don't hand that signal over. They export summaries instead, such as steps, active minutes and sleep stages, computed by algorithms their makers don't publish.
That difference decides what your endpoint can become later. Raw data can be reprocessed with a new or better validated algorithm years after the last participant finishes. A vendor summary can't. This guide covers the layers of accelerometer data, the sampling rate each endpoint needs, which wearables expose raw signals, and a protocol checklist for choosing between the two.
Key Takeaways
- Raw beats summaries for endpoints: raw triaxial g data can be reprocessed with one open algorithm across devices and firmware versions; vendor counts and steps cannot.
- Counts are not a unit: activity counts depend on the device, the filter and even the sampling rate, so open metrics took over: NHANES 2011 to 2014 published MIMS units, and GGIR defaults to ENMO.
- Sampling rate is fit for purpose: 10 Hz kept activity recognition accuracy, 20 Hz suited fall detection and kept MIMS units within 5% for many activities except running, and impact biomechanics need hundreds of Hz.
- Raw access is gated: Garmin, Samsung, Apple, Withings and ActiGraph expose raw data behind SDKs, entitlements or contracts, and Polar only over a live Bluetooth link; Oura, WHOOP and Fitbit document no raw route.
- WeGuide's route: native Garmin integration, which collects raw accelerometer and gyroscope data at 25 Hz on supported models; other devices arrive as summaries via Apple Health or Health Connect.
What Is Accelerometry?
Accelerometry is the use of an accelerometer to record movement as acceleration over time, plus the methods that turn that record into measures of behavior. The accelerometer is the sensor. Accelerometry is the measurement method and the data it produces, from the raw signal up to the summary outcomes a study reports.
A modern wearable accelerometer is a MEMS chip (micro electromechanical system) a few millimeters across. You'll find one in almost every watch, ring, patch and research monitor. It measures acceleration along three perpendicular axes, x, y and z, which is why researchers talk about triaxial accelerometry. The unit is g, the acceleration of gravity at the Earth's surface, about 9.81 m/s².
One detail trips up newcomers. An accelerometer measures proper acceleration, so gravity is always in the signal. A wrist resting on a table reads about 1 g, split across the three axes depending on how the wrist is tilted.
van Hees and colleagues describe the raw signal as three components: movement, gravity and noise. Much of accelerometry methods work is about separating them.
Where the sensor sits changes the data. In a lab study of children and adults wearing monitors on both hip and wrist, wrist output was generally higher than hip output for the same activities (Hildebrand 2014). Thresholds built for one location don't carry over to another, so wear location belongs in the protocol, not in a footnote.
In clinical research, accelerometry is used to measure:
- Physical activity volume and intensity
- Sedentary time
- Sleep and wake patterns
- Steps and walking bouts
- Gait measures such as walking speed and stride velocity
- Tremor and other involuntary movement
- Falls
The methods have changed a lot in two decades. Troiano and colleagues traced how physical activity research moved from proprietary counts toward analysis of the raw signal, and that shift shapes every section below.
Accelerometer vs Gyroscope: What Each Sensor Measures and What an IMU Adds
An accelerometer measures linear acceleration plus gravity, which makes it good at detecting tilt, impacts, steps and overall movement intensity. A gyroscope measures angular velocity: how fast the device rotates around each axis. Put the two together and you have an inertial measurement unit (IMU), sometimes with a magnetometer added to correct heading drift.
For a wearable study, the difference shows up in what you can measure well. Acceleration alone captures how much someone moves and when. Rotation adds the detail that acceleration blurs: turning during walking, arm swing, the rotational part of tremor, and how the body changes orientation during a fall.
Gravity gives the accelerometer a rough sense of orientation, but only while the device is fairly still. During fast movement, gravity and motion mix in the signal, and a gyroscope helps pull them apart.
The trade off is power and data. Gyroscopes typically draw more battery than accelerometers, and six channels take twice the storage of three. Most physical activity research still runs on accelerometer data alone. Gait, tremor and fall research are where a wearable IMU earns its place.
Three Layers of Accelerometer Data: Raw g, Activity Counts and Vendor Metrics
Accelerometer data comes in layers, from the raw signal at the bottom to vendor metrics at the top. Each layer up is smaller and easier to use. Each layer up also removes your ability to go back down, so the layer you collect sets the ceiling on what you can do with the data later.
| Layer | Example | Open formula? | Comparable across devices? | Can be reprocessed later? |
|---|---|---|---|---|
| Raw triaxial signal | x, y, z in g at a fixed Hz | Not needed | Yes, after calibration and resampling | Yes |
| Open summaries | ENMO (mg), MIMS units, Activity Index | Yes | Better (MIMS designed for it) | Only if raw data are kept |
| Proprietary counts | ActiGraph counts per epoch | Open since 2022 | No, device and rate dependent | No |
| Vendor metrics | Steps, active minutes, sleep stages | No | No, algorithm and firmware dependent | No |
Raw triaxial signal
Raw accelerometer data is the stream of x, y and z values in g at a fixed sampling rate. Research monitors typically record somewhere between 10 and 100 Hz (Bai 2016). At 25 Hz, one week of continuous wear is about 15 million samples per axis. That volume is the price of flexibility: every metric below can be computed from it, and recomputed.
Open summaries: ENMO, MIMS units and the Activity Index
ENMO, short for Euclidean Norm Minus One, is the simplest open metric. Take the vector magnitude of x, y and z, subtract 1 g to remove gravity, round negative values to zero, and average over an epoch. It's reported in milli g (mg). ENMO has been the default metric in the open source GGIR package since it was created (GGIR documentation), building on the van Hees 2013 work on separating movement from gravity.
MIMS units (Monitor-Independent Movement Summary) were built to solve the device problem. The algorithm harmonizes raw data from devices with different dynamic ranges and sampling rates, keeps the 0.2 to 5.0 Hz band where normal human movement sits, and aggregates the result (John 2019). In shaker tests on eight accelerometers spanning ±2 to ±8 g and 20 to 100 Hz, MIMS units varied less between devices than ActiGraph counts or ENMO.
NHANES then used MIMS at population scale. The 2011 to 2014 cycles recorded wrist acceleration "every 1/80th of a second (80 Hz)" on ActiGraph GT3X+ monitors and published minute level MIMS values (CDC NHANES documentation). Belcher 2021 built US reference percentiles from 14,705 participants on that basis, as a standard that applies across wrist worn devices.
The Activity Index is a third open option. In 194 women aged 60 to 91, both the Activity Index and ENMO were more sensitive to moderate and vigorous activity than activity counts (Bai 2016).
Activity counts
Activity counts are the legacy layer. The device filters the signal, rectifies it and sums it per epoch into a number that isn't a physical unit. For decades, ActiGraph's count algorithm was proprietary. In 2022 the company described the algorithms of five device generations and published the current one as an open Python package (Neishabouri 2022).
Open doesn't mean portable, though. Counts depend on the filter and even on the sampling rate. During running, ActiGraph monitors produced 600 to 1,600 more counts per minute at 40 or 100 Hz than at the default 30 Hz (Brønd 2016). For device specifics, see our guide to ActiGraph counts and research grade actigraphy.
Vendor metrics
Steps, active minutes, intensity minutes and sleep stages sit at the top. Each comes from a firmware or cloud algorithm the maker doesn't publish and can change without notice. Our explainer on how watches turn accelerometer data into steps shows how far these numbers drift between devices and wear locations.
Accelerometer cut points and their limits
Cut points turn a continuous signal into categories: sedentary, light, moderate and vigorous. The first national US accelerometer survey, NHANES 2003 to 2004, used hip worn count thresholds. By that measure, fewer than 5% of adults met the recommendation of 30 minutes of moderate or vigorous activity a day, far below what self report suggested (Troiano 2008).
Raw data metrics have their own thresholds, and they differ by wrist and hip. In Hildebrand 2014, classification accuracy was 93% to 97% for sedentary and light activity and 68% to 92% for vigorous activity. For moderate activity it was only 33% to 59%.
That moderate band is exactly where endpoints built on moderate to vigorous physical activity (MVPA) sit. Treat any cut point as specific to its population and placement, and report the continuous metric alongside the categories.
Why Raw Accelerometer Data Matters for Clinical Endpoints
Raw accelerometer data lets you choose the algorithm, rerun it, audit it and apply it the same way across devices. Vendor summaries lock a study into an algorithm it can't inspect, and that algorithm can change partway through a trial. For an exploratory outcome, that may be acceptable. For a primary or key secondary endpoint, it's a risk to price in early.
There are four practical reasons to collect raw data:
- Reprocessing. If a better validated algorithm appears after database lock, or a reviewer asks for a sensitivity analysis, raw data can be run again. Summaries can't.
- Device independence. One open metric applied to raw g from different devices gives comparable outputs. Vendor metrics from different devices don't.
- Version drift. FDA guidance on digital health technologies for remote data acquisition asks sponsors to "keep a record of the timing and nature of any updates for each DHT" and warns that "significant changes in the measurement after updates may invalidate the results from a clinical investigation." Raw data from before and after a firmware update can go through the same pipeline. A step count can't.
- Recalibration. Calibration error is a known source of bias. van Hees 2014 showed raw data can be recalibrated after collection, using still periods when the device should read 1 g. In a Brazilian cohort, calibration error fell from 76.7 mg to 8.0 mg. That correction needs the raw signal.
The same FDA guidance separates two kinds of evidence. Verification confirms that "the parameter that the DHT measures (e.g., acceleration, temperature, pressure) is measured accurately and precisely." Validation confirms that the technology assesses the clinical characteristic in the population you're studying.
The guidance gives a pointed example: a step algorithm built on healthy participants "may not be applicable for participants with Parkinson's disease with a shuffling gait." With raw data, you can validate or swap the algorithm for your population. With summaries, you inherit the vendor's choice.
Don't overstate the regulatory case, though. FDA treats the data in the first durable electronic data repository they're transferred to as the source data for records collected through these technologies (our guide to wearables as eSource explains what that means in practice). The guidance also says FDA generally "does not intend to request machine or raw data that require electronic processing to be understood (e.g., voltages) during an inspection." Raw accelerometry is a scientific choice, not an FDA mandate.
Raw data also costs more. Files are large, battery life drops, a processing pipeline has to be built and validated, statisticians need time, and consent language has to cover continuous sensor collection. Budget for all of it before you commit.
The payoff can be an endpoint regulators accept. In 2023 the EMA qualified stride velocity 95th centile, a wearable measure of walking speed in daily life, as a primary endpoint in superiority studies of ambulant Duchenne muscular dystrophy patients aged 4 and above, as an alternative to the 6 minute walk test, provided consistent findings in established secondary efficacy endpoints support it (EMA qualification opinion). Our guide to digital endpoints covers how measures like this are built and qualified.
Need the raw movement signal, not just steps?
WeGuide's native Garmin integration collects raw accelerometer and gyroscope data at 25 Hz on supported models, next to eConsent and ePRO in one participant app.
Accelerometer Sampling Rate: How Many Hz Does Your Endpoint Need?
There's no universal accelerometer sampling rate: 10 Hz preserved activity recognition, 20 Hz suited fall detection and kept MIMS units within 5% for many daily activities, while impact peaks in running need at least 199 Hz. The right rate depends on the metric, the activity and where the sensor is worn. Most voluntary human movement sits below about 5 Hz, which is why MIMS units keep the 0.2 to 5.0 Hz band. By the Nyquist rule, the sampling rate has to be more than twice the highest frequency you want to keep, and a margin above that guards against aliasing.
Recent evidence makes the trade off concrete. Straczkiewicz 2026 took 315 hours of labeled triaxial data from 321 participants across 11 public datasets, harmonized it at 50 Hz and downsampled it to 40, 30, 20, 10 and 5 Hz. For MIMS, 20 Hz stayed within a 5% error margin for many walking, stair climbing, cycling, jumping, household and motorized transport conditions.
Running at lower limb and trunk locations broke that margin at 20 Hz. At 10 Hz, errors rose for most ambulatory activities.
The paper's conclusion is the right default for any protocol: choose the rate that's fit for purpose, not one rate for everything.
| Endpoint or task | Rate the evidence supports | Is 25 Hz enough? | Source |
|---|---|---|---|
| Activity recognition (sitting, walking, household tasks) | 10 Hz kept accuracy at wrist and chest | Yes | Yamane 2025 |
| Fall detection with machine learning | 10 to 20 Hz; 20 Hz gave the best balance | Yes | Villa 2025 |
| Free living metrics (MIMS) for walking, stairs, cycling | 20 Hz within 5% error | Yes | Straczkiewicz 2026 |
| Running at lower limb or trunk | Above 20 Hz | Borderline, check your metric | Straczkiewicz 2026 |
| Step counting, gait speed, tremor amplitude | Depends on the algorithm | Validate in your population | FDA DHT guidance |
| Impact peaks (tibial shock, running biomechanics) | At least 199 Hz | No | Aubol 2023 |
| ActiGraph count generation | 30 Hz default (60 or 90 Hz also work); other rates add spurious counts | Not applicable | Brønd 2016 |
The supporting detail for each row:
- Activity recognition. In 30 healthy participants, dropping to 10 Hz caused no statistically significant loss of recognition accuracy at the non dominant wrist or chest; dropping to 1 Hz cut accuracy for many activities (Yamane 2025).
- Falls. A CNN LSTM model at 20 Hz reached 98.9% accuracy, 96.7% sensitivity and 99.6% specificity, and held up on real fall recordings (Villa 2025). Our explainer on how fall detection algorithms work covers the rest of the pipeline.
- Gait and tremor. For gait speed and tremor amplitude, no single study sets the rate. The algorithm decides what it needs, and FDA expects validation in your population.
- Impact peaks. In 19 runners, peak tibial acceleration was 0.5 to 1.4 g lower at 102 Hz than at higher rates, and the authors recommend at least 199 Hz (Aubol 2023).
In plain terms, the cited evidence supports 25 Hz for activity volume and intensity metrics such as MIMS units, activity recognition and machine learning fall detection. For steps, sleep, gait and tremor, the answer depends on the algorithm, so check that yours was validated at the rate you plan to collect, in your population. 25 Hz doesn't fit impact peaks or high frequency biomechanics. For those, use a research IMU that samples in the hundreds of Hz.
Higher rates aren't free. They cost battery, storage and sync time, and a higher rate won't rescue a poorly chosen metric. State the rate in the protocol and justify it with evidence for your specific endpoint.
What Each Wearable Actually Exposes: A Raw Data Access Matrix
Most wearables expose raw accelerometry only through an SDK, an entitlement or a research contract, and some don't expose it at all. What a device can expose and what a given platform collects are separate questions, so the matrix keeps them in separate columns.
Cloud APIs mostly deliver summaries, a route covered in our guide to wearable APIs for clinical research. This matrix covers the raw signal only. For battery life, regulatory status and other sensors, use our research wearable comparison, which cites the maker's documentation for every device.
WeGuide collects raw sensor data only from supported Garmin models.
| Device | What the device or vendor SDK exposes (vendor capability) | Access route and gate | What WeGuide collects |
|---|---|---|---|
| Garmin wrist wearables | Real time sensor streams, including accelerometer | Garmin Health Standard or Companion SDK; Garmin notes some models may not be supported | Native Garmin integration: raw accelerometer and gyroscope data at 25 Hz on supported models |
| Samsung Galaxy Watch | Raw triaxial accelerometer at 25 Hz | Samsung Health Sensor SDK, with partner app verification | Summaries via Health Connect; no raw |
| Apple Watch | Recorded accelerometer data (CMSensorRecorder); raw sensors through SensorKit | Your own app; SensorKit needs an Apple approved study and entitlement | Summaries via Apple Health (HealthKit); no raw |
| Polar H10 and Verity Sense | Accelerometer plus ECG (H10) or PPG (Verity Sense) streams | Polar BLE SDK over a live Bluetooth link | Summaries via Apple Health or Health Connect where Polar writes them; no raw |
| Withings ScanWatch | Raw accelerometer and PPG (Withings research raw data API) | Gated by Withings; continuous raw capture cuts battery to about 3 to 4 days | Summaries via Apple Health or Health Connect (new Withings accounts need Withings+ to share); no raw |
| ActiGraph LEAP | Raw data at 32 to 256 Hz | CentrePoint V3 API | Not integrated |
| Oura Ring | No raw accelerometer or PPG in the API | Oura API v2 | Summaries via Apple Health or Health Connect |
| WHOOP | No raw route documented by the maker | Not applicable | Summaries via Apple Health or Health Connect |
| Fitbit Air | No raw route documented by the maker | Not applicable | Supported (summary data) |
Sources for the vendor column: Garmin Health SDK overview, Samsung Health Sensor SDK data specifications and app verification, Apple's CMSensorRecorder and SensorKit (SRSensorReader and SRFetchRequest) documentation, the Polar BLE SDK, Withings API plans, ActiGraph CentrePoint V3 data access files, the ActiGraph LEAP 510(k) summary and the Oura API v2 docs.
A few gates are easy to miss:
- Samsung: the raw stream needs partner app approval before your app can use it.
- Apple: SensorKit holds data for 24 hours before release and only reaches back 7 days.
- Withings: continuous raw capture shortens battery life sharply, and new accounts need Withings+ to share data with Apple Health or Health Connect.
Vendor terms change, so recheck every row when the protocol is finalized.
Raw Garmin Accelerometer and Gyroscope Data in WeGuide
WeGuide has a native Garmin integration, which collects raw accelerometer and gyroscope data at 25 Hz on supported models. Garmin is the only route for raw sensor data on WeGuide, so studies that need raw movement signals should plan on Garmin wearables.
That gives a study team three things: open pipelines such as GGIR or MIMSunit on the raw g data, gyroscope channels for turning, rotation and orientation work, and the option to reprocess later with a different metric or a newer algorithm. Studies can run BYOD first on participants' own Garmin watches; provisioned devices are supported when a protocol needs them.
Participants get a clear prompt in the WeGuide app to grant access to their Garmin data, and they can revoke consent at any time.
Data can be exported for a single participant or for the whole cohort. Sensor collection sits in the same participant app as ePRO questionnaires and eConsent, with version control, reconsent tracking and an audit trail.
There are limits to plan around:
- 25 Hz. The sampling evidence supports it for activity metrics, activity recognition and fall detection; confirm that your step, sleep or gait algorithm was validated at 25 Hz. It doesn't cover impact biomechanics.
- Supported models only. Check the current list on WeGuide's Garmin integration page before fixing devices in the protocol.
- Plan the processing pipeline. WeGuide collects and exports the raw data; agree up front who runs and validates the processing pipeline.
Other devices, including Apple Watch, Oura and Withings, reach WeGuide as summaries via Apple Health or Health Connect. Fitbit Air is supported for summary data, and other Fitbit models arrive via Health Connect. Garmin's cloud Health API delivers summaries too. The raw signal comes through the SDK route, and our comparison of Garmin's cloud Health API and its Health SDKs explains where that line sits.
Processing Raw Accelerometer Data: GGIR, MIMS and Open Pipelines
Open source pipelines turn raw g into outcomes you can audit and reproduce. The steps are similar whichever tool you use. A systematic review by Migueles 2017 found no consensus across studies on any of these decisions, from placement and sampling frequency to filter, epoch length, non wear and valid day rules, which makes results hard to compare.
- Import and check timestamps. Confirm sampling rate, time zone and gaps for every file.
- Calibrate. Apply autocalibration against gravity using still periods (van Hees 2014).
- Detect non wear. Flag periods when the device was off the body.
- Compute an epoch metric. ENMO, MIMS units or the Activity Index, at a fixed epoch length.
- Classify. Apply intensity cut points, sleep detection or activity recognition models.
- Apply valid day rules. Set minimum wear time per day and minimum valid days per participant before analysis.
Karas 2019 lists the problems a pipeline has to handle: data volume, differences between devices, wear location, sensor rotation, sampling frequency, calibration, activity labeling and synchronization. A written pipeline is how you show each one was handled the same way for every participant.
Three tools cover most needs:
- GGIR, listed on CRAN as "Raw Accelerometer Data Analysis", reads files from common research monitors and from any brand whose data are stored as CSV. It uses ENMO by default.
- MIMSunit is the open implementation of MIMS units.
- ActiGraph's open counts package (Neishabouri 2022) reproduces counts from raw data when you need comparability with older count based studies.
Pin the pipeline. Name the package, the version and every parameter in the statistical analysis plan before unblinding. A software update can change a default just as a firmware update can change a step count.
A Protocol Checklist: Vendor Summaries or Raw Signal?
Run through this list before the protocol is final. Each item maps to a decision that's hard to reverse once enrollment starts.
- Endpoint and metric. Name the endpoint and the exact metric behind it, such as daily MIMS units, minutes above an ENMO threshold or SV95C.
- Raw or summary. Decide whether you need raw data for reprocessing, comparability across devices, an algorithm validated in your population, or questions a reviewer may ask later.
- Devices and models. Fix the device list and models in the protocol, including what happens when a participant's own device isn't on it.
- Wear location. Specify wrist (and which wrist), hip, thigh or ankle, and keep it the same for every participant.
- Sampling rate. Justify the rate with evidence for your endpoint, using the sampling table above.
- Wear time and valid days. Define minimum hours per day and valid days per participant. Our wear time calculator helps set realistic targets.
- Calibration and versions. Record device firmware and app versions at enrollment and at every update, as the FDA guidance recommends.
- Pipeline. Pin the processing software, version and parameters in the SAP.
- Consent. Make sure the consent wording covers continuous raw sensor collection, storage and future reprocessing.
- Data integrity. Keep raw files with their original timestamps and an audit trail, in line with ALCOA+ expectations for original wearable data.
If your endpoints sit in mobility, gait or physical activity, our page on movement studies shows how WeGuide supports these studies.
What This Means for Your Study
Accelerometry gives clinical research an objective, continuous view of how people move. The value of that view depends on which layer you keep. Vendor summaries are convenient and fine for exploratory work. Raw triaxial data costs more to collect and process, but it's the only layer you can recalibrate, reprocess and compare across devices and firmware versions.
Decide early. Pick the metric, justify the sampling rate, choose devices that expose what you need, and pin the pipeline before the first participant enrolls. Those choices decide whether your data can answer new questions years from now.
Accelerometry FAQs
What is the difference between actigraphy and accelerometry?
Accelerometry is the general method of measuring movement as acceleration. Actigraphy is one application of it, traditionally a wrist or hip monitor summarizing movement into counts to estimate activity and sleep and wake patterns over days or weeks. All actigraphy is accelerometry; not all accelerometry is actigraphy. Our guide to actigraphy in clinical research covers the devices and methods.
What is a MEMS accelerometer?
A MEMS (micro electromechanical system) accelerometer is a chip a few millimeters across with a tiny suspended mass that shifts when the device accelerates. The chip turns that shift, in wearables usually a change in capacitance, into acceleration in g along up to three axes. It's the sensor inside almost every smartwatch, ring and research monitor.
What is the difference between an accelerometer and a gyroscope?
An accelerometer measures linear acceleration plus gravity, so it captures movement intensity, tilt, steps and impacts. A gyroscope measures angular velocity: how fast the device rotates. Together they form an inertial measurement unit (IMU), which adds turning, arm swing and rotational tremor to what acceleration alone shows.
What is an activity count?
An activity count is a summary of filtered acceleration over an epoch, such as one minute. It isn't a physical unit. Counts depend on the device, the filter and even the sampling rate, so counts from different devices aren't directly comparable. ActiGraph published its count algorithm as open source in 2022.
What is ENMO in accelerometry?
ENMO stands for Euclidean Norm Minus One. It's the vector magnitude of the x, y and z signals minus 1 g, with negative values set to zero, averaged over an epoch and reported in milli g; GGIR uses it by default.
What are MIMS units?
MIMS units (Monitor-Independent Movement Summary) are an open metric designed to give similar values across devices with different sampling rates and dynamic ranges. NHANES 2011 to 2014 published its wrist data as MIMS units.
What sampling rate do research accelerometers use?
Research accelerometers typically record between 10 and 100 Hz. NHANES 2011 to 2014 used 80 Hz, ActiGraph counts assume a 30 Hz default, and Samsung's Health Sensor SDK streams at 25 Hz. Evidence supports 10 to 20 Hz for activity recognition and falls, but impact biomechanics need at least 199 Hz.
Can you get raw accelerometer data from an Apple Watch?
Yes, but only through your own app. Apple's CMSensorRecorder gathers accelerometer data from the device, and SensorKit offers raw sensors to Apple approved studies with an entitlement. Apple Health does not hold the raw signal, so WeGuide receives Apple Watch data as summaries via Apple Health.
Do Oura, WHOOP or Fitbit give raw accelerometer data?
No. Oura's API v2 has no raw accelerometer or PPG endpoints, and neither WHOOP nor Fitbit (Fitbit Air or Charge 6) documents a raw route. Studies get the summaries each maker computes. The research wearable comparison lists which devices do expose raw data, and how.
How accurate is an accelerometer?
The sensor measures acceleration well, and small calibration errors can be corrected from raw data. Most error comes from placement, the algorithm and the population. Intensity classification is weakest for moderate activity: in one wrist and hip study it was right only 33% to 59% of the time, compared with 93% to 97% for sedentary and light activity.
What can a wrist accelerometer detect?
A wrist accelerometer can detect physical activity volume and intensity, sedentary time, sleep and wake patterns, steps, tremor and falls. Combined with a gyroscope, it adds turning and rotation.
Is 25 Hz enough for gait analysis?
It depends on the measure and the algorithm. In a 2026 analysis of 11 datasets, MIMS values stayed within 5% of a 50 Hz reference at 20 Hz for many walking conditions, so 25 Hz covers free living walking volume. No single study sets the rate for gait speed or stride measures, so validate your gait algorithm at 25 Hz in your population. It is not enough for impact peaks or detailed running biomechanics, where a tibial acceleration study recommends at least 199 Hz.
Plan a movement study on raw sensor data
See how WeGuide combines Garmin raw accelerometer and gyroscope data with eConsent, ePRO and a branded participant app in one platform.
Book a demoNo pressure, just a conversation.

